PAPER CHASERS
A payroll dashboard for Teamshares
TL;DR
This design effort delivers an increase in productivity of 50% (analysis time taken down from 3 hours to roughly 1.5 hours). This solution reduces analysis by removing the requirement of retrieving data and plotting data points in a spreadsheet.
The end result being more productive and richer conversations between Industry Leads and Network Presidents around payroll as it relates to profitability and efficiency.
User Research
Systems Thinking
Productivity
Ambiguity
Team: Design Lead (myself), Product Manager, Engineer, Users & Stakeholders
THE PROBLEM
Conversations around payroll involve a lot of legwork on the part of the Industry Leads who oversee Teamshares Network Companies by industry. With over 90 Network Companies acquired, the effort around retrieving and analyzing payroll data is multiplied greatly.
How do we reduce the amount of time it takes for Industry Leads to gain valuable, actionable payroll insights?
RESEARCH & EXPLORATION
Initial conversations uncovered that Industry Leads pull data—which we already knew. So I dug into understanding what this data collection entails.
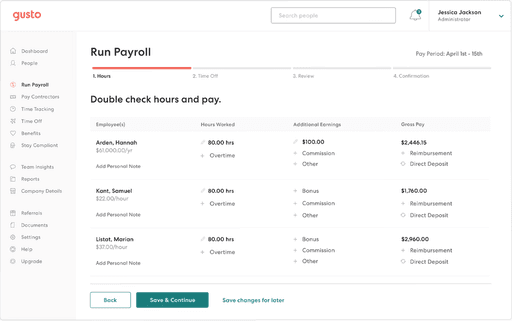
Log into a wide variety of payroll services used by our Network Companies. It's worth noting that these payroll services can vary from company to company.
Import the information into Metabase
Import from Metabase into the spreadsheet app of choice where a great amount of processsing and analysis happens
Having conversations with Network Presidents under their purview
Repeat these steps multiplied by the number of companies in your given industry
Within TeamsharesOS, there was no visibility into payroll outside of these third-party payroll systems. This process was extremely time intensive.
But what data are they looking at? The situation at Teamshares is unique in that we're pulling from multiple systems. Step 1 was finding out what data was available.
STARTING WITH INTEGRATION
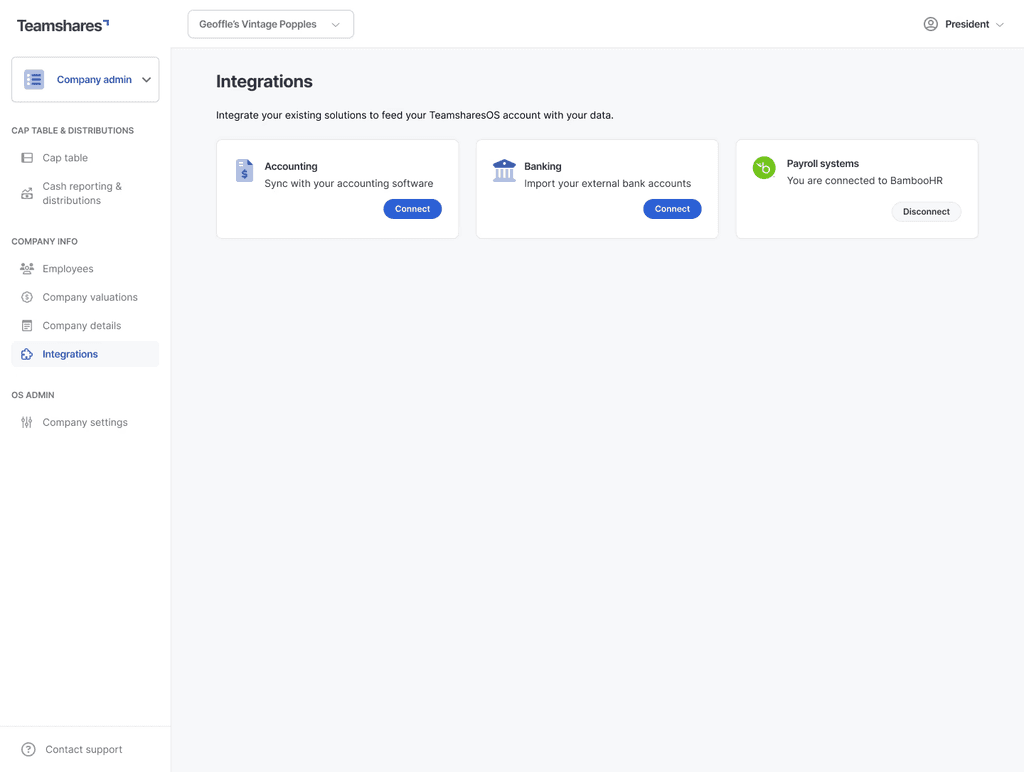
Off the bat, planning for an integration feature was a given. This presents a great opportunity to create something scalable to account for other Teamshares products to add services for integration. One such example is Financial Products' need to integrate Quickbooks Online.
I reached out to the other teams to get buy-in to set this feature in motion.
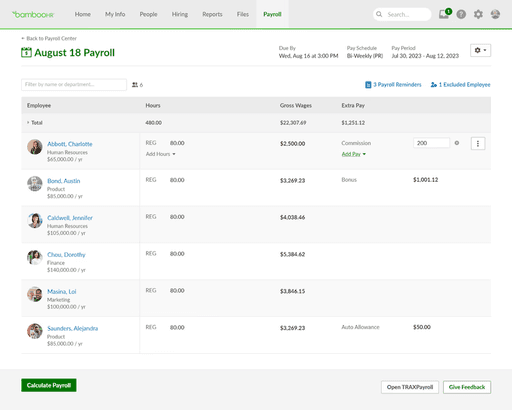
So I dug in to research existing payroll systems to put together an initial design to push the conversation forward.
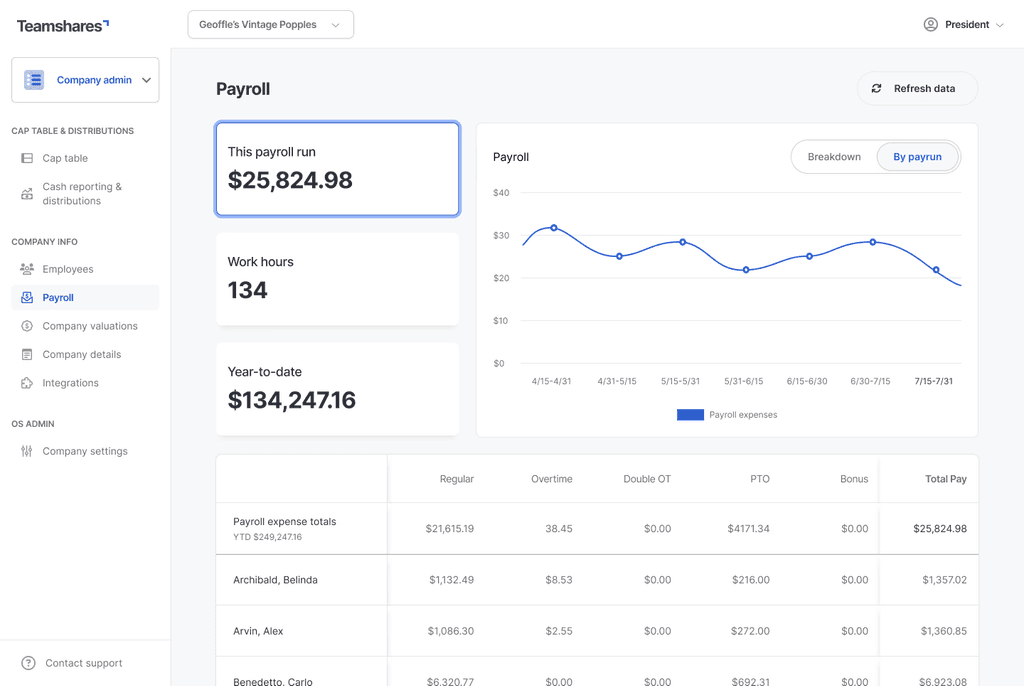
THE DASHBOARD
Feedback around the first shot at a dashboard sparked stakeholders' and Industry Lead's interest. My favorite part of what we do is dreaming up the possibilities with users. How can I make this more helpful for you?
A sketch here, tweak there…
Feedback around the first shot at a dashboard sparked stakeholders' and Industry Lead's interest. My favorite part of what we do is dreaming up the possibilities with users. How can I make this more helpful for you?
A sketch here, tweak there…
We combed through one of the financial stakeholder's spreadsheet files, and he showed me a waterfall chart. He explained how they worked and asked hopefully, "is this something we can do?"
A quick Google search revealed that there is indeed a library that handles waterfall charts. Shot a Slack over to our Lead Engineer to confirm. It's a go!
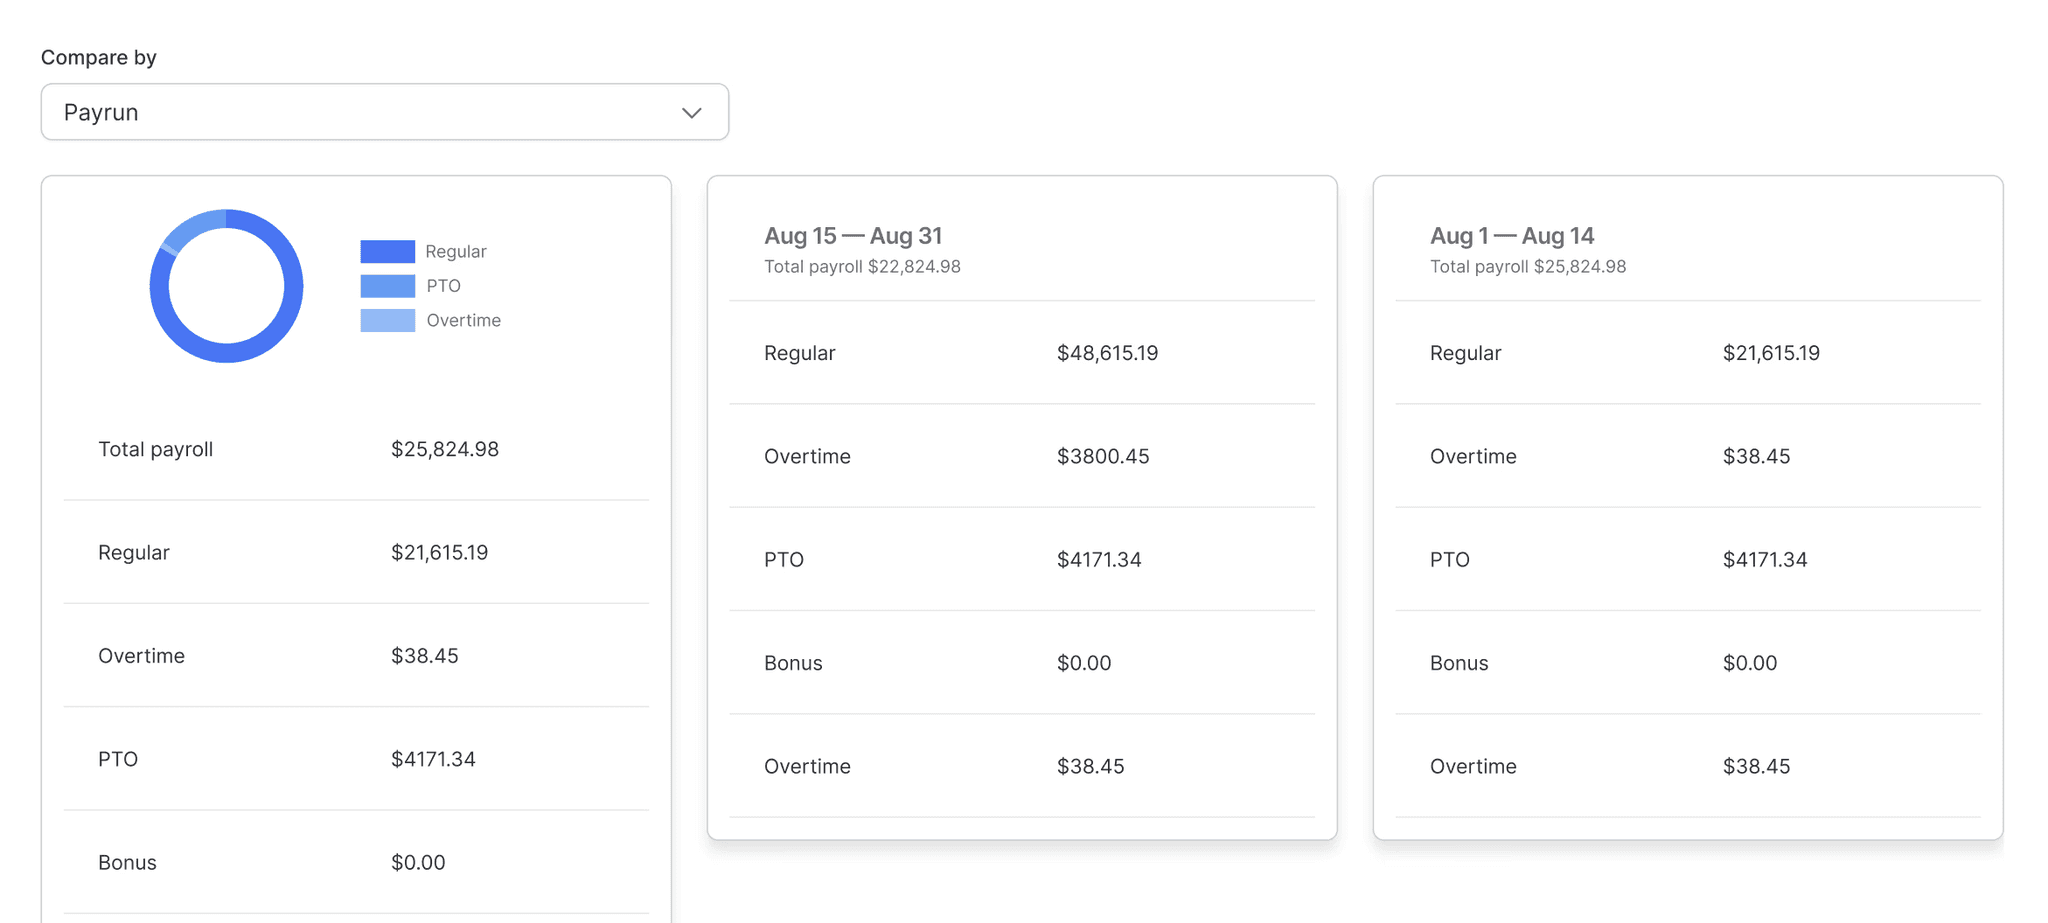
He expressed their need to be able to compare data on the same screen. The prior designs had one period per screen, so I had some ideas.
FINDING OPPORTUNITIES
What this also uncovered was the potential of updating Teamshares employee rosters using payroll, as payroll would be the source of truth. If someone is terminated or hired, the first thing that tends to happen is removing or adding to payroll.
A bit later on down the road, I put together this workflow to address the updating of the TeamsharesOS employee rosters via integration efforts.
THE LANDING PLACE
After extracting what Industry Leads found useful for analyzing payroll, this is what we landed on. A waterfall chart, adjustable to the selected period, as well as a detailed look at payroll data by summary and wage detail.
Display preferences allows for the selection of different periods for comparison. Wage detail reflects these selections. This gives our Industry Leads and Network Presidents alike the data they need to make decisions around payroll costs.
This design eliminates the need to plug data into their spreadsheets and create separate charts on their own. Integration allows for the transmission of data to TeamsharesOS, and with that access to data, this presentation layer gives our Industry Leads the ability to analyze and compare data from different periods to make their conversations more flexible.
OUTCOMES
From final testing, this design effort promises an increase in productivity of 50%, doing away with the legwork needed prior to analysis and discussion with Network Presidents. This allows Industry Leads to cover more ground in a shorter period of time when prepping for their bi-weekly one-on-ones.
The added bonus here is the ability to compare different time periods for greater analysis.
The end result being more productive and richer conversations between Industry Leads and Network Presidents—in half the amount of time.
Shipping recently, this feature takes Teamshares on its way to greater profitability.
L DANTE GUARIN
DESIGN AND HAIKU ARE COOL
LET'S WORK TOGETHER
L DANTE GUARIN
DESIGN AND HAIKU ARE COOL
LET'S WORK TOGETHER
L DANTE GUARIN
DESIGN AND HAIKU ARE COOL
LET'S WORK TOGETHER
(925) 336-3336 | me@ldanteguarin.com