2022
Systems Thinking
Ambiguity
Information Architecture
Team
Design Lead: Dante
PM: Rimas
Engineer: Brett
Research: Dante, Rimas
Users & Stakeholders:
Software Engineers, CTO
The Problem
With the product focus moving from Data Engineers to Software Engineers, the actual work would then happen in the Command Line and a code editor of choice. What useful features could we provide for our customers in the Dashboard? It can't be just a thing for billing, right?
Research & Exploration
Meroxa launched in 2021 aimed toward Data Engineers who would build data pipelines on the Meroxa platform in significantly less time than it would traditionally take. Like the tagline used to proudly state, "...in minutes, not months".
The product vision ended up outgrowing simple data pipelines in a browser-based pipeline builder, to make way for much more complex data applications. We're talking Software Engineer-grade complexity. Enter Turbine, the code-first data application framework. Wait, code-first? What happens to the pipeline builder? I'll get into that.
Some Background
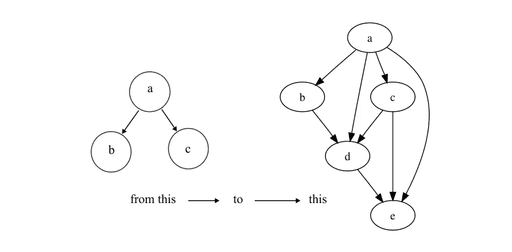
There's a lot of backstory before we got to this point. The quick and dirty is that prior to the final decision to go down the code-first data application platform journey, we explored Multi-Streams, which built on the pipeline model, where you could build multiple streams within a single pipeline. Then the conversation shifted towards a DAG (Directed Acyclic Graph)-like data flow structure. Then, finally the epiphany: we discovered that among our users, Software Engineers were our biggest group. As luck would have it, there are way more Software Engineers than Data Engineers (generally speaking). More Software Engineers, bigger impact building whole data applications in what would be named Turbine. Mo' money, mo' money, mo' money—theoretically.
A lot to sort out at this stage. There had been features we worked on like Environments (dedicated, shared, self-hosted) that would split data applications into desired containers. I tried to fit these into the first iterations.
It's worth mentioning that I had taken over and grew the Design System that I named "Yoshi" (Get it? Super Mario's lil homie that helped him speed through pipes? Meroxa Pipelines?). This gave me the ability to quickly throw together screens.
First Approach:
Everything but the Kitchen Sink

Second Approach:
We Have a Grid for That
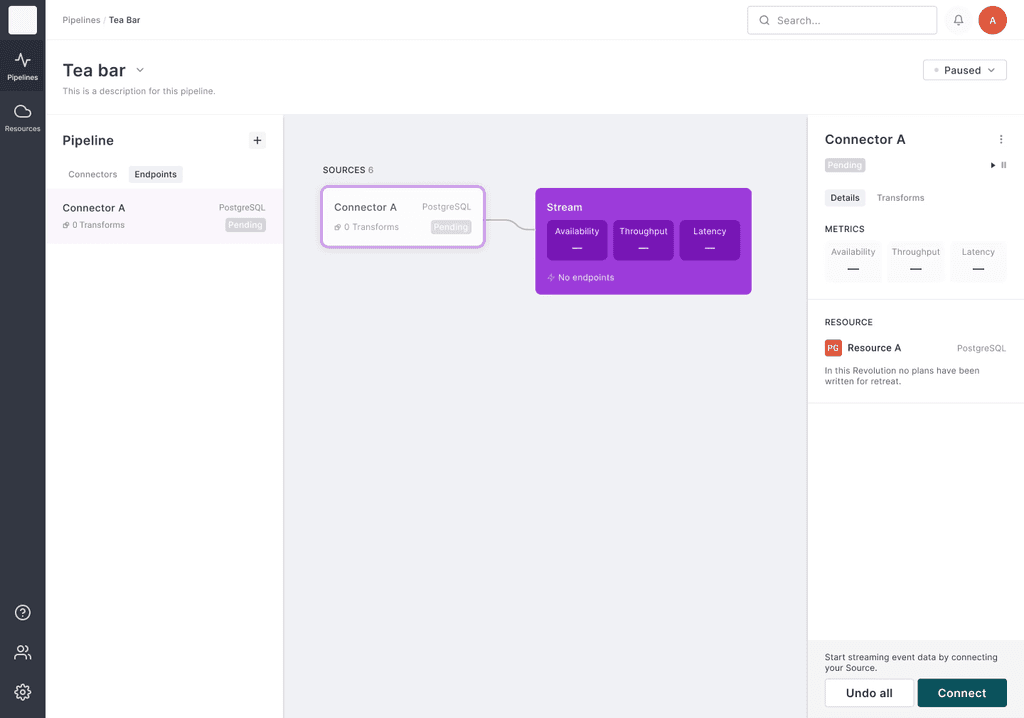
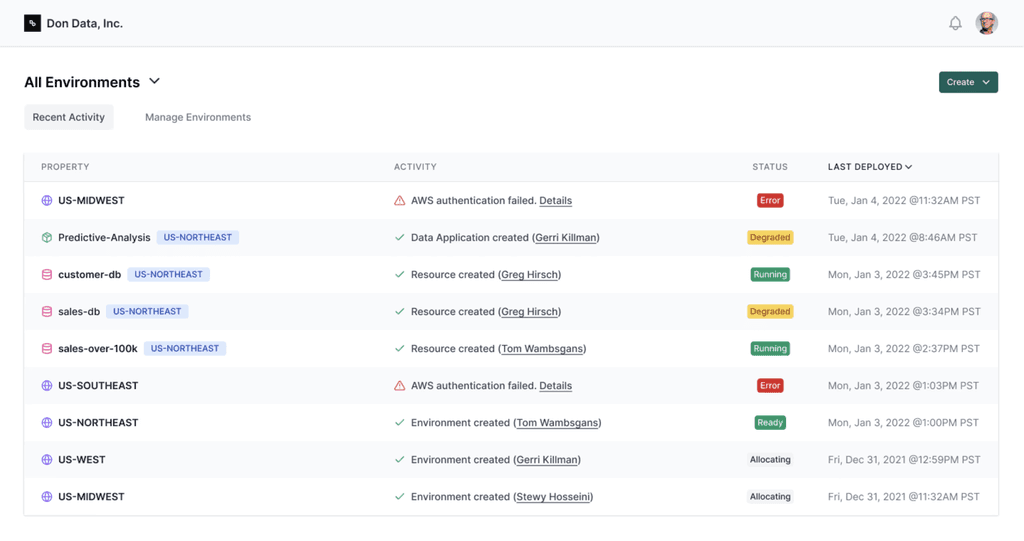
I got hit with an idea that maybe we could present an Activity Feed so users can get a good idea of what's happened in chronological order. Presenting this information inside of a grid allowed for easy sorting. So, if a user wanted to list all the errors at the top of the grid, they can click on the status column header.
Adding an activity column would then provide us with a better means to give users readable details on the actions taken with any item on the screen. This grid display, however, would require more horizontal space, so I made adjustments to the navigation, in favor of context-based tabs.
Feedback from Engineers was that I was getting warmer with what would be useful for them and their workflows.
Third Approach:
Hit Different
I went much deeper with this iteration. Looking at the prior designs, the main thing I felt was missing was some data. We're a data company, right? Makes sense. Also, I went with dark mode. Inspired by GitHub, Vercel, and conversations with in-house Engineers and Engineers that I know outside of Meroxa. This iteration received great response from stakeholders. The review yielded some great feedback around finetuning what we're displaying.
Let's Ship It
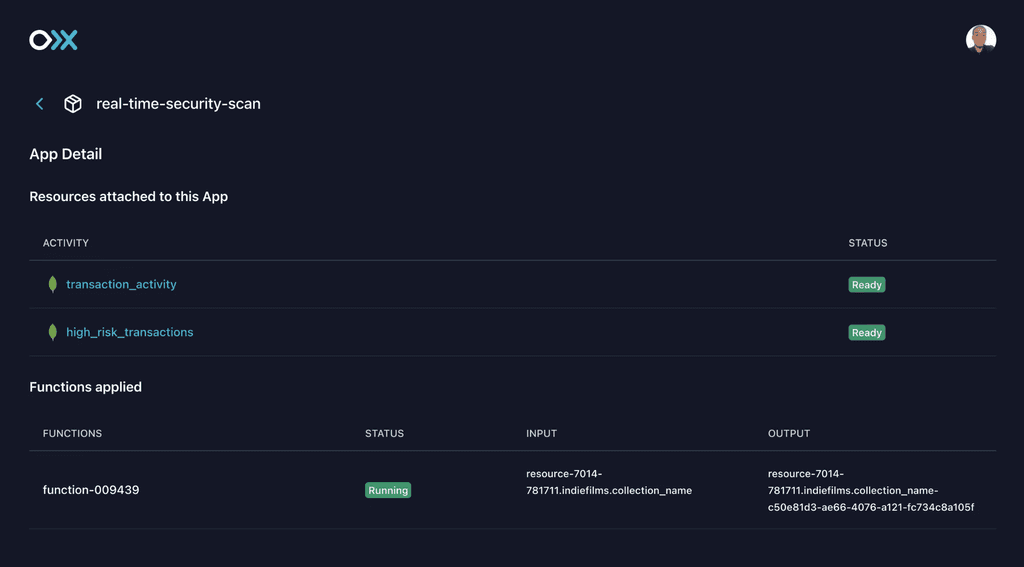
Final implementation stripped out Environments, Logs, and the Data Application Map—all to be implemented at a later date.